Wind turbine farms represent one of the most significant developments in modern electricity generation. These installations, consisting of dozens to hundreds of individual turbines working together, have transformed how countries produce power and address climate change. From the windswept plains of Texas to the stormy waters of the North Sea, wind farms now generate enough electricity to supply millions of homes worldwide.
This guide explains what wind turbine farms are, how they work, and where the largest installations operate today. You’ll learn about the technical differences between onshore and offshore wind projects, understand the planning process behind these massive energy infrastructure investments, and explore both the environmental benefits and challenges they present.
Key facts about wind turbine farms:
| Metric | Onshore | Offshore |
|---|---|---|
| Typical turbine rating (2025-2026) | 3-6 MW | 12-18 MW |
| Hub height | 100-160 m | Up to 260 m |
| Capacity factor | 30-40% | 50-65% |
| Installation cost per kW | $1,200-1,800 | $3,500-4,500 |
| Notable examples include China’s Gansu Wind Farm with over 7,965 MW installed and a target of 20,000 MW by around 2025-2030, the UK’s Hornsea 2 at 1,386 MW powering over 1.3 million homes since August 2022, and California’s Alta Wind Energy Center producing approximately 1,550 MW across 600 turbines. |
What is a wind turbine farm and how does it work?
A wind turbine farm is a collection of utility scale wind turbines deployed together to generate electricity on a commercial scale. These wind power plants convert the kinetic energy of moving air into electrical power through coordinated turbine operations, with multiple units feeding into a shared infrastructure that connects to the electric grid.
The main components of modern wind turbines include, and understanding how wind turbines work in large wind farms helps explain how these elements interact:
- Towers ranging from 80-150 meters onshore to over 260 meters offshore
- Rotor blades typically three per turbine, spanning 50-130 meters in length, made from fiberglass or carbon fiber
- Nacelle housing the gearbox, generator, yaw system, and control electronics
- Transformers stepping up voltage for efficient transmission
- Internal collection grid connecting all turbines to a central substation
The energy conversion process follows a straightforward sequence. When wind blows across the rotor blades, their aerodynamic shape creates lift, causing rotation at 10-20 RPM. This motion spins the main shaft, which connects to a gearbox that increases rotational speed to 1,500-1,800 RPM suitable for the generator. The generator produces three-phase AC electricity, typically at 690V, which transformers then boost to 20-66 kV for the farm’s collection system. At the central substation, voltage increases further to 132-400 kV for transmission to the wider power grid.
A critical relationship governs wind energy production: power output is proportional to wind speed cubed. This means doubling the wind speed increases available power eightfold, explaining why site selection focuses intensely on wind resource quality.
By 2025-2026, onshore turbines typically rate 3-6 MW with rotor diameters of 130-160 meters. Offshore wind turbines reach 12-18 MW, with models like the GE Haliade-X at 14 MW already commercialized and 20+ MW prototypes under testing. These larger wind turbines achieve higher capacity factors—the ratio of actual output to theoretical maximum—ranging from 30-40% onshore to 50-65% offshore. In practical terms, a 5 MW onshore turbine might produce 13-17 GWh annually, while an equivalent offshore unit could deliver 26-28 GWh.
Types of wind turbine farms
Wind farms are categorized primarily by their location relative to the coast. The three main categories—onshore, nearshore, and offshore—differ significantly in wind resource characteristics, installation costs, visual impact, and grid connection complexity.
Each type leverages distinct advantages. Onshore wind farms dominate global capacity at roughly 85% of installations, benefiting from lower costs and easier access. Offshore wind farms access stronger, more consistent winds but require substantially higher investment. Nearshore installations occupy a middle ground, combining enhanced wind resources with relatively accessible logistics.
Onshore wind turbine farms
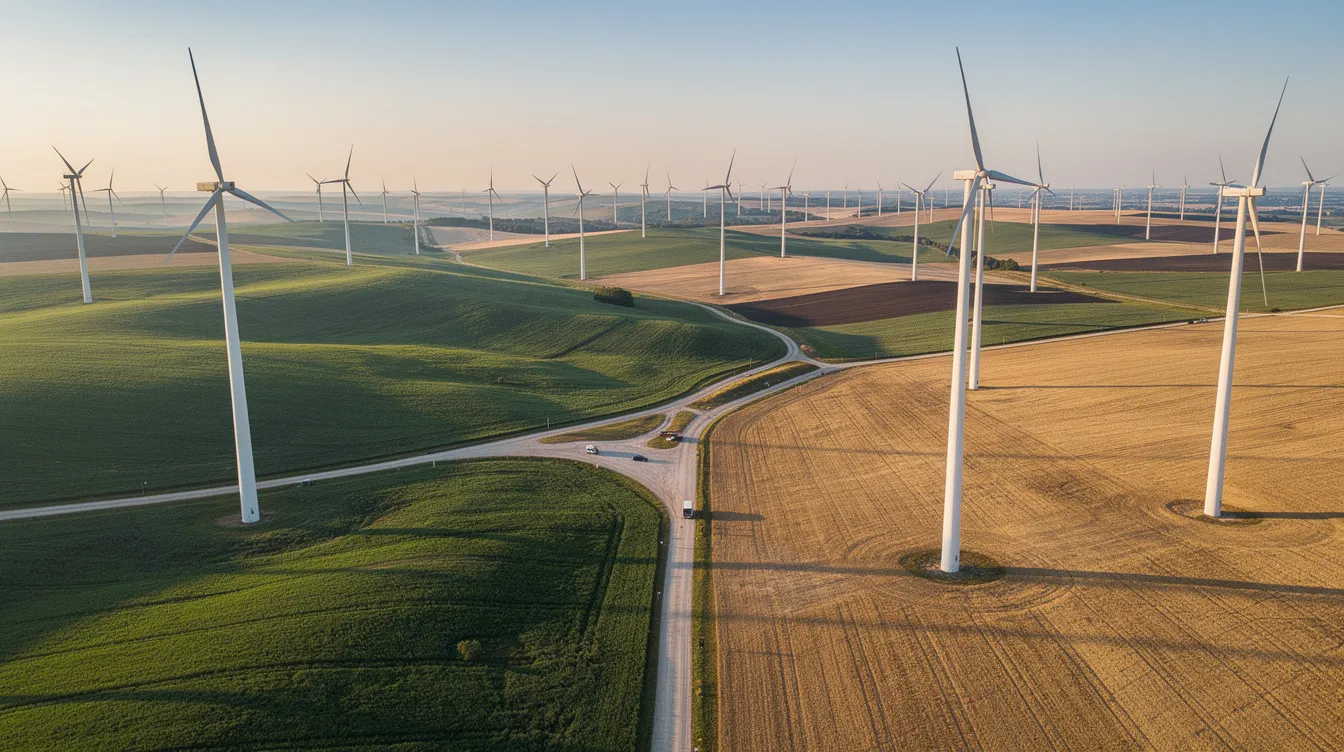
Onshore wind farms are located on land, typically at least 3 kilometers from the coastline. These installations represent the backbone of global wind energy production, with suitable sites found across diverse terrain types.
Common onshore locations include:
- Open plains like the Texas Panhandle and Midwest prairies
- Mountain passes such as California’s Altamont Pass, Tehachapi, and San Gorgonio
- Ridgelines across Europe, particularly in Spain, Germany, and Scandinavia
Typical onshore turbines rate 3-6 MW with hub heights of 100-160 meters. Capacity factors average 30-40%, translating to approximately 2.6-3.5 GWh per MW annually. The Alta Wind Energy Center in California’s Tehachapi Pass exemplifies large-scale onshore wind, producing roughly 1,550 MW across 600 turbines and supplying power to about 320,000 homes.
Advantages of onshore wind:
- Lower installation costs ($1,200-1,800 per kW)
- Maintenance costs of $30-40k per MW annually
- Road access simplifying construction and repairs
- Shorter grid connections
- Mature supply chains and workforce
Challenges include:
- Land use considerations (1-2 acres per MW direct footprint)
- Visual impact prompting 1-2 km setbacks from residences
- Noise levels of 35-45 dB at 300 meters (comparable to quiet conversation)
- Permitting timelines extending 2-5 years
States like Texas, which produces more wind energy than any other U.S. state (40 GW), Iowa (12 GW), and Oklahoma lead U.S. onshore development, while China’s Gansu complex represents the world’s largest onshore wind farm with plans exceeding 20,000 MW.
Nearshore wind turbine farms
Nearshore wind farms occupy a transitional zone—either on coastal land within approximately 3 km of the shoreline or in very shallow waters close to shore. These projects capitalize on the interaction between land and sea breezes, often achieving 5-10% higher capacity factors than comparable inland sites.
Denmark’s North Sea coast and Germany’s Baltic shores host significant nearshore development, including extensions to the Horns Rev complex. These locations balance enhanced wind resources with manageable construction logistics compared to deep-water installations.
Advantages of nearshore wind:
- Combined land-sea breezes providing consistent winds
- Easier construction and maintenance access than deep offshore
- Shorter subsea cable runs reducing costs
- Proximity to ports streamlining logistics
Trade-offs to consider:
- Coastal erosion concerns affecting foundations
- Bird migration flyways requiring curtailment protocols
- Tourism and visual impact sensitivity
- Regulatory complexity at land-sea boundaries
- Higher corrosion rates than pure onshore sites
Installation costs typically range $2,000-3,500 per kW, positioning nearshore between the economics of onshore and offshore wind projects.
Offshore wind turbine farms
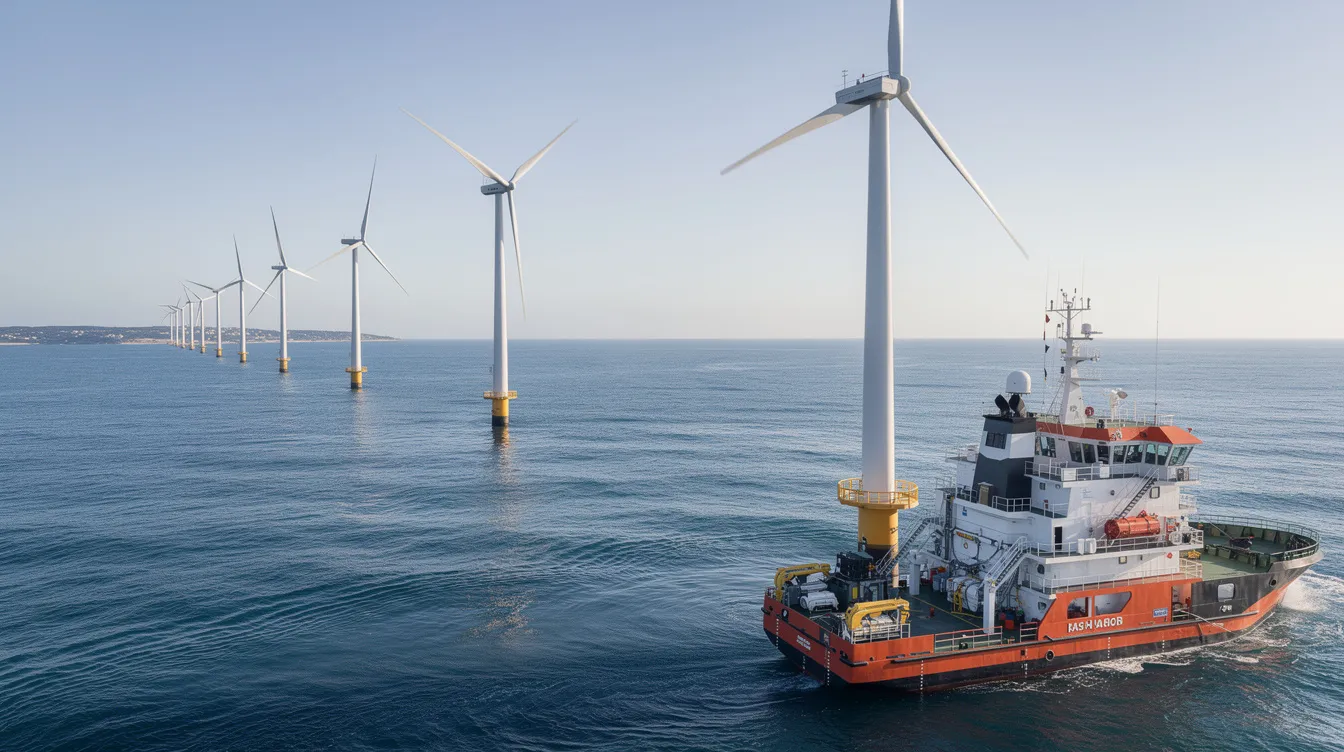
Offshore wind farms consist of turbine arrays built in seas, oceans, or large bodies of water, often 10-100 kilometers from the coast. These installations access the open sea’s stronger, more uniform wind patterns while avoiding many onshore constraints.
Modern offshore wind turbines represent the cutting edge of wind technology. Units rated 12-18 MW with rotor diameters of 220-260 meters are standard in 2025-2026, with prototypes exceeding 20 MW under development. The UK’s Hornsea projects in the North Sea illustrate this scale—Hornsea 1 (1,218 MW, 2019) and Hornsea 2 (1,386 MW, 2022) together exceed 2.6 GW, powering over 2.5 million homes.
Other major offshore wind farms include China’s Jiangsu clusters (7+ GW combined), Germany’s Borkum Riffgrund (342 MW), and the phased Dogger Bank development targeting 3.6 GW by the late 2020s. Early U.S. projects like Block Island in Rhode Island (30 MW, 2016) and Coastal Virginia’s pilot array (12 MW) have paved the way for larger east coast developments.
Key advantages:
- Capacity factors of 50-65% yielding 4.4-5.7 GWh per MW annually
- Vast contiguous areas available for development
- Reduced visual and noise impacts onshore
- Access to stronger, steadier wind speeds (8-11 m/s vs. 6-8 m/s onshore)
Major challenges:
- Capital expenditure of $3,500-4,500 per kW
- Complex foundations accounting for 20-30% of total cost
- Floating platforms required for depths exceeding 60 meters
- Subsea cable installation and maintenance
- Harsh marine conditions including storms and icing
- Operations and maintenance costs of $50-80k per MW annually
Siting and planning a wind turbine farm
Careful siting determines whether a wind farm succeeds financially and operationally. The planning process typically spans 3-7 years, from initial feasibility studies through permitting, financing, and construction, and must incorporate robust management of the risks of working on a wind farm for construction and operations crews.
Developers use multi-year wind measurements from meteorological masts (80-150 meters tall) and remote sensing technologies like LiDAR and SODAR to characterize the wind resource. Software tools such as WAsP and WakeFarmer model expected annual energy production with 5-10% accuracy, while safety assessments consider common wind turbine injuries for technicians who install and maintain this equipment.
Core siting criteria include:
- Wind resource quality: Average speeds exceeding 6.5-7.5 m/s at hub height with turbulence intensity below 16%
- Terrain and geology: Smooth terrain minimizes wake effects; soil bearing capacity must exceed 100 kPa onshore
- Grid access: Available transfer capability within 10-50 km to limit interconnection upgrade costs to $100-300 per kW
- Environmental constraints: Buffers from protected habitats, bird migration corridors, and bat roosts
- Social acceptance: Setbacks from residences (500-1,000 m), airports (5 km), and community engagement programs
- Permitting pathways: Understanding local, regional, and national approval requirements
Developers often establish community benefit funds ($5-10k per MW annually) and conduct extensive stakeholder engagement to secure local support.
Electricity grid and technical layout considerations
Grid integration represents a critical planning element. Developers assess available transfer capability and proximity to high-voltage transmission lines or substations to minimize costly grid reinforcements. The interconnection request process with transmission system operators involves queue positions, feasibility studies, impact assessments, and security deposits ($10-50k per MW).
Technical layout optimization balances energy capture against installation costs. Standard turbine spacing ranges from 3-5 rotor diameters crosswind and 6-10 rotor diameters downwind to minimize wake losses, which can reduce downstream turbine output by 10-20%.
Collection system design elements:
- Medium-voltage collection grid (33-66 kV) linking turbines
- Pad-mounted transformers at each turbine
- Central substation with voltage step-up to 132-400 kV
- Reactive power compensation equipment (capacitors, STATCOMs) maintaining 0.95 power factor
- For offshore: subsea export cables spanning 30-100 km to onshore grid nodes
Offshore wind farms often require offshore substations housing transformers rated up to 400 MVA, with high-voltage DC (HVDC) connections for distances exceeding 80-100 km to minimize transmission losses.
Major wind turbine farms around the world
The world’s largest wind farm installations span multiple continents, with capacity growing rapidly as countries pursue renewable energy targets.
Leading onshore installations:
| Project | Location | Capacity | Notes |
|---|---|---|---|
| Gansu Wind Farm | Jiuquan, China | 7,965 MW+ | Target 20,000 MW by ~2025-2030 |
| Alta Wind Energy Center | California, USA | ~1,550 MW | 600 turbines in Tehachapi Pass |
| Muppandal Wind Cluster | Tamil Nadu, India | ~1,500 MW | Multiple projects in windy area |
| Shepherds Flat | Oregon, USA | 845 MW | Operational since 2012 |
| Traverse Wind | Texas, USA | 656 MW | Part of Texas’s 40 GW portfolio |
| Regional onshore patterns show strong growth across central U.S. states—Texas leads with approximately 40 GW, followed by Iowa (12 GW), Oklahoma, Kansas, and Illinois (10-15 GW each by 2025). China dominates global additions, accounting for roughly 50% of new capacity. |
Leading offshore installations:
| Project | Location | Capacity | Status |
|---|---|---|---|
| Dogger Bank A/B/C/D | UK North Sea | 3.6 GW | Phased completion 2024-2029 |
| Hornsea 1 + 2 | UK North Sea | >2.6 GW | Fully operational |
| Jiangsu Dafeng | China | 940 MW | Part of 7+ GW cluster |
| Horns Rev 3 | Denmark | 407 MW | Operational |
| Block Island | Rhode Island, USA | 30 MW | First U.S. offshore farm (2016) |
| Europe targets 260 GW of offshore capacity by 2030, while the U.S. east coast pipeline includes multiple GW-scale projects from Massachusetts to Virginia. |
Environmental and landscape impacts
Wind plants produce electricity with minimal operational emissions. Lifecycle analyses show wind power emits less than 10 gCO2 per kWh—compared to 400-800 for natural gas and coal power plants. A single GW of wind capacity displaces an estimated 1-2 million tonnes of CO2 annually, making wind energy central to addressing climate change.
Land use considerations:
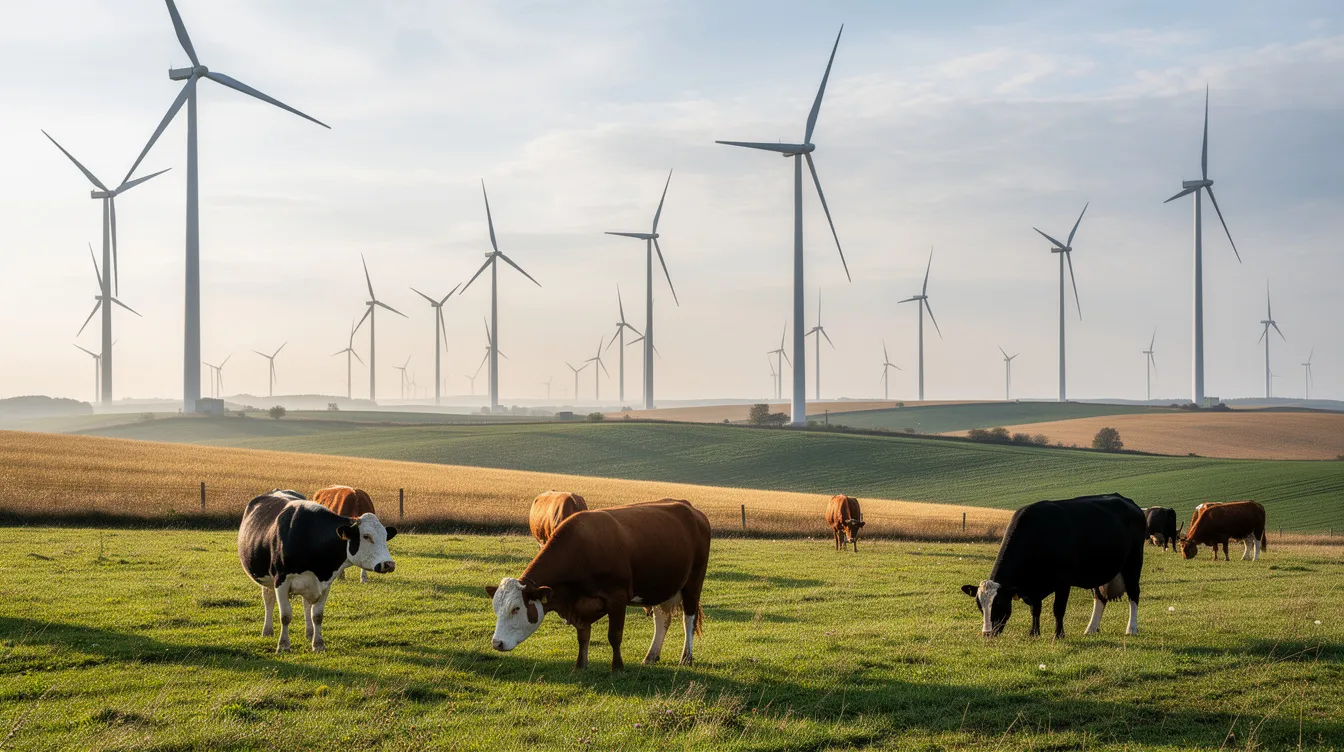
Wind farms require 30-100 acres per MW of spatial footprint, but permanently seal less than 5% of that area with turbines, roads, and substations. This allows compatible agricultural uses—approximately 90% of onshore wind farm land remains available for grazing or crops. Many farmers receive lease payments while continuing their operations.
Visual impact:
Turbines visible across 10-20 km horizons alter landscapes, prompting varied community responses. Planning authorities often require visual simulations, color-matching paint schemes, and buried collection cables to minimize aesthetic effects. Setback requirements from residences typically range 500-1,000 meters.
Noise levels:
Modern turbines generate 45-55 dB(A) at 100 meters—roughly equivalent to light traffic or office background noise. At 300 meters, levels drop to approximately 35-45 dB(A), comparable to quiet conversation. Health concerns about living near wind turbines often focus on noise and infrasound, but infrasound concerns have been studied extensively, with frequencies below 1 Hz found negligible in peer-reviewed research.
Wildlife effects:
Bird and bat collisions represent the primary biodiversity concern, with mortality rates of 0.01-0.4 birds per turbine annually depending on species and location. Raptors and migratory bats face higher risks, and broader analyses of accidents and risks caused by wind turbines often include these wildlife impacts. Mitigation measures include:
- DTBird and similar curtailment systems reducing collisions by 50-80% with less than 5% energy loss
- Avoiding ridge lines and migration corridors during siting
- Pre-construction radar surveys identifying high-risk periods
End-of-life management:
Turbines operate for 20-25 years before requiring decommissioning or repowering. Questions about who is responsible for removing wind turbines are addressed in project contracts and regulation, alongside broader decommissioning plans. Repowering strategies replace older smaller turbines with fewer, larger units—potentially doubling energy production with 40% fewer machines. Blade recycling remains challenging, though pyrolysis and chemical processes targeting 90% material recovery are advancing toward commercial scale by 2030.
Effects on power grids and system reliability
Large wind farms interact extensively with power transmission infrastructure. Grid codes require wind generators to provide frequency and voltage control, maintain fault ride-through capability (remaining connected during grid disturbances), and limit ramp rates to manageable levels—typically below 10% of capacity per minute.
The variable nature of wind power—dependent on weather patterns and wind speed fluctuations—requires system operators to employ multiple management strategies, while operators also manage injury risks encountered on a wind turbine farm through training and safety protocols:
- Forecasting: 24-72 hour predictions with 5-10% mean absolute error
- Geographic diversification: Arrays spread across 100+ km reduce output variability by 30-50%
- Flexible generation: Gas turbines and hydropower providing backup
- Demand response: Adjusting industrial loads to match supply
- Storage: Battery systems handling short-term fluctuations
- Interconnections: Trading power across regions and other countries
Several nations demonstrate that high wind penetration works reliably. Denmark generates approximately 48% of annual electricity from wind, Ireland achieves 35%, and the UK reaches 25%—all without storage dominance or reliability compromises.
Distributed wind farms offer security advantages over centralized power plants. Multiple dispersed turbines are less vulnerable to single-point failures, extreme weather events affecting one location, or potential targeted disruptions than large thermal facilities concentrated at single sites, even though accidents caused by wind turbines can still occur and must be managed through robust safety practices.
Interactions with radar, radio, and local environments
Turbine blades and towers can interfere with certain radar systems. Rotating blade tips create Doppler clutter with apparent velocities up to 200 m/s, affecting air traffic control and weather radar installations. This has historically delayed several GW of U.S. wind capacity, including contributing to the cancellation of Cape Wind.
Mitigation approaches include:
- Establishing 5-10 km no-build zones around critical radar facilities
- Radar software upgrades and adaptive signal processing ($1-5 million per site)
- Experimental low-reflectivity blade coatings and materials
- Coordinated siting during planning phases
Radio, TV, and telecommunications signals may experience shadowing when turbines fall within Fresnel zones between transmitters and receivers. Modern modeling tools predict potential interference during planning, typically applying thresholds limiting signal loss to less than 1%.
Local microclimate effects:
Meta-analyses of large onshore wind farms report small near-surface temperature changes—approximately +0.2-1°C at night and -0.5°C during daytime—resulting from turbine-induced atmospheric mixing. Some research suggests potential benefits for agriculture through 2-5% increased evaporation and reduced frost risk, though data remains limited, and debates continue over possible symptoms linked to so‑called wind turbine syndrome.
Economic aspects and future outlook for wind turbine farms
Wind turbine cost trends show dramatic improvements over the past decade. Onshore levelized cost of electricity (LCOE) has fallen to $25-50 per MWh in 2024—roughly half the level of 2010—driven by larger turbines, Chinese manufacturing reaching $800/kW, and operational efficiencies. Offshore wind LCOE ranges $50-100 per MWh, declining approximately 7% annually.
Project economics fundamentals:
| Cost Component | Onshore | Offshore |
|---|---|---|
| Capital expenditure | $1,200-1,800/kW | $3,500-4,500/kW |
| O&M costs | $20-40k/MW/year | $50-80k/MW/year |
| Project lifetime | 25-30 years | 25-30 years |
| Typical IRR | 8-12% | 8-12% |
| Power purchase agreements and competitive auctions structure most utility scale electricity generation projects. European auctions have achieved €40-60 per MWh, while U.S. contracts reach $25-35 per MWh in strong wind resource areas. The American Wind Energy Association and Energy Information Administration track these trends across the country. |
Geographic cost variations persist. China and India achieve lower installed costs through domestic manufacturing and labor rates. Europe and North America face higher costs but benefit from strong policy support, including the U.S. Inflation Reduction Act’s tax credits.
Trends toward 2030 and beyond:
- Offshore turbines reaching 15-25 MW
- Floating wind technology enabling 60+ meter depth installations (e.g., Hywind Scotland’s 30 MW pilot)
- Hybrid projects combining wind, solar, and 2-hour storage achieving $30/MWh LCOE
- “Supergrid” concepts linking Baltic and North Sea wind parks
- Continued cost reductions making wind increasingly cost effective against fossil fuels
The Department of Energy and International Energy Agency project that achieving net-zero pathways requires approximately 3,800 GW of global wind capacity by 2050—supplying roughly 35% of world electricity. Wind industry growth remains essential to meeting EU climate neutrality targets, U.S. clean energy goals, and similar commitments across dozens of other countries.
Key takeaways:
- Wind turbine farms convert wind into electricity through coordinated turbine arrays feeding shared grid infrastructure
- Onshore wind farms dominate current capacity with lower costs, while offshore wind offers higher yields and larger turbines
- Siting requires multi-year wind assessment, grid access analysis, and extensive environmental and community engagement
- Environmental impacts are low relative to fossil fuels, though wildlife and visual concerns require active management
- Grid integration works reliably at high penetration levels when combined with forecasting, diversification, and flexible resources
- Economics continue improving, positioning wind power as a cornerstone of global energy needs through 2050
Whether you’re evaluating wind energy production for investment purposes, understanding policy implications, or simply curious about where electricity comes from, wind turbine farms represent one of the most consequential technologies of the energy transition.